Results per Sample Point Report and Graph
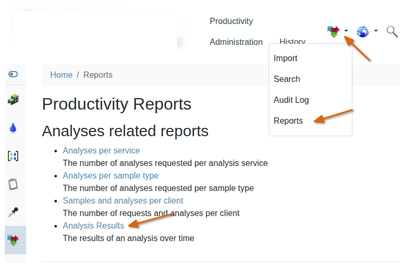
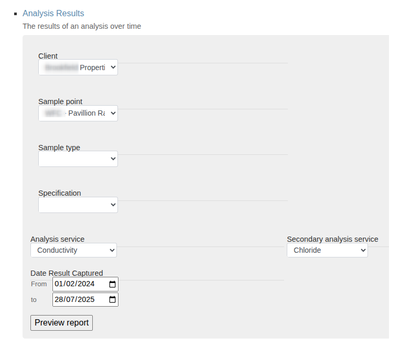
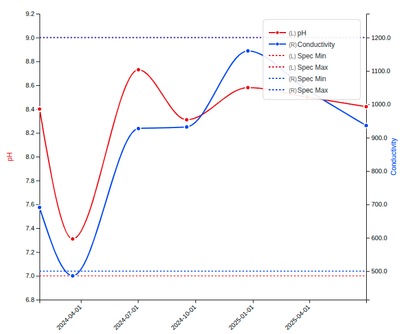
BackgroundThe report plots two analyses’ results over time for a user selection of parameters. The results values are plotted as y-coordinates for the data points, using a y-axis on both left and right-hand sides, demarcated in the Analyses’ units. The data points’ datetime Analysed serve as x-coordinates. Navigate to 'Analysis Results on the Reports page A Parameter section of the page oens for users to capture the parameters for which the results must be tabled and graphed.They may complete any combination of search parameters offered for the plot/report from look-up menus, to group the data that must be graphed and tabled Most of the time the user will, apart from the Analyses, only select the Analyses that must be graphed, the time period for the plot and one other parameter, typically Sample Point. Analyses and dates are the only compulsory fields
|
The user selects a Client, all of whom's Sample Points are offered in the Sample Point look-up If plotting the valid range lower and upper control limits (LCL/UCL) the user must select a Sample Type from those listed for the Sample Point and then a corresponding Specifications are available in the Specification lookup Press [Preview report]
|
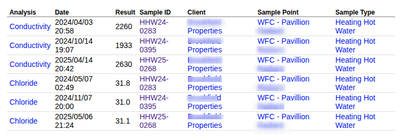
The report renders with a graph of all the data points found as well as a table of the Analyses, hyperlinked for the user to drill down on problematic results Where the results exceed limits of detection (on the day of the report), thye are drawn as horizontal lines and annotated in the legend Ditto for the selected Specification. These limits may also vary over time - the report uses the spec on the day of the report Once rendered, the report is exported as PDF
|


