Skip to content. | Skip to navigation

Personal tools

  • Log in
Advanced Search…
Bika LIMS

Navigation

  • Home of the Bika Open Source LIMS project
  • Features and Benefits
  • Products
  • Professional Services
  • Collective Resources
  • User Manual
  • Demos ⋅ Videos
  • About Bika - Contact
  • FAQ
  • 中国人
You are here: Home / Images / Diagrams and Graphs
Info

Diagrams and Graphs

Bika Open Source LIMS Security diagram
Analysis Results per Sample Point Graph in Bika Open Source LIMS
Time Series Graph in Bika Open Source LIMS
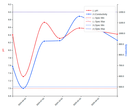
Dual Y-axis results per Sample Point plot in Bika Open Source LIMS
« Previous 12 items 1 2 [3]


Bika Lab Systems 400x

Professional Bika / Senaite Service Provider


64 x png  Slack chat room. Access


News
Bika Wine: Open-Source LIMS returns to wineries Oct 01, 2025
Management Reports return in Bika 4 Sep 08, 2025
The Leopard in Your Lab: Ingwe Bika LIMS 4 Aug 14, 2025
New release soon, Ingwe, Bika LIMS 4 Jul 31, 2025
Concrete. New Bika LIMS Branch Feb 26, 2025
More news…
  • Powered by Plone & Python
  • Site Map
  • Accessibility
  • Contact