Using Control Charts for Temperature Monitoring
Incubator, refrigerator and water bath temperatures are measured in Micro-biology labs and can be graphed using Bika's QC Control Charts. Tutorial. Pioneered by Francois le Roux at Test It water quality lab
Analysis Service
Set up a Fridge Temperature Analysis Service, preferably in a Temperature Monitoring Category
Save
Manual, Analysis Services

Reference Definition
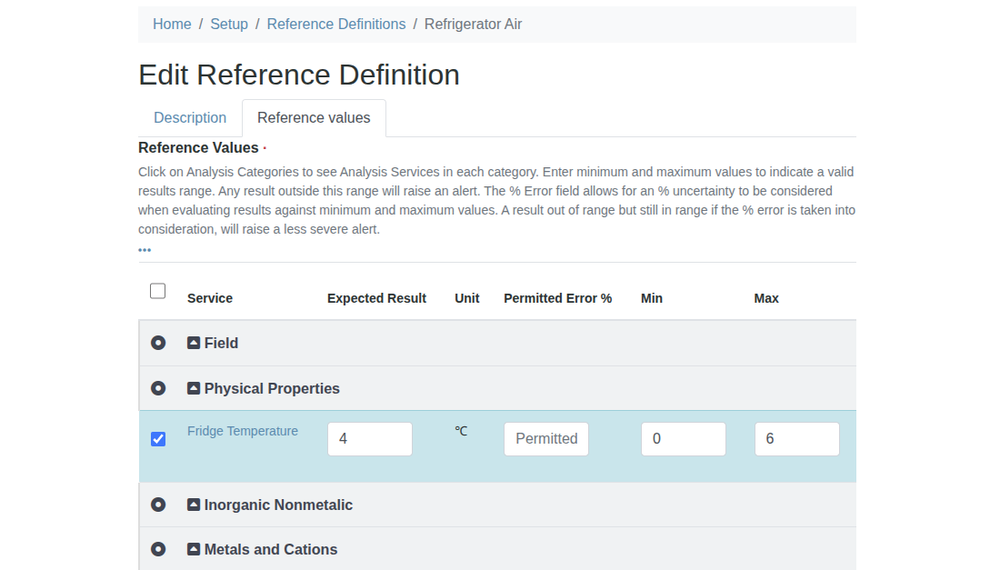
From the Setup, configure a Reference Definition for the Fridge Temperature Analysis Service
Configure the expected result to be 4 ℃, the minimum 0 ℃ and maximum of 6 ℃
Save
Manual, Reference Definitions

Reference Sample
Navigate to Suppliers and create a Supplier for the Lab itself, here we use Inhouse Supplies
Create a reference Sample for the supplier using the Refrigerator Air Reference Definition
NB. You need a reference Sample per fridge you'll be monitoring, using the fridges specific Reference Definition

Give it an Expiry date far in the future, it will only expire when the fridge dies

Save, the Reference Values tab will autocomplete using the Reference Definition's values
Manual, Reference Samples
Worksheet Template
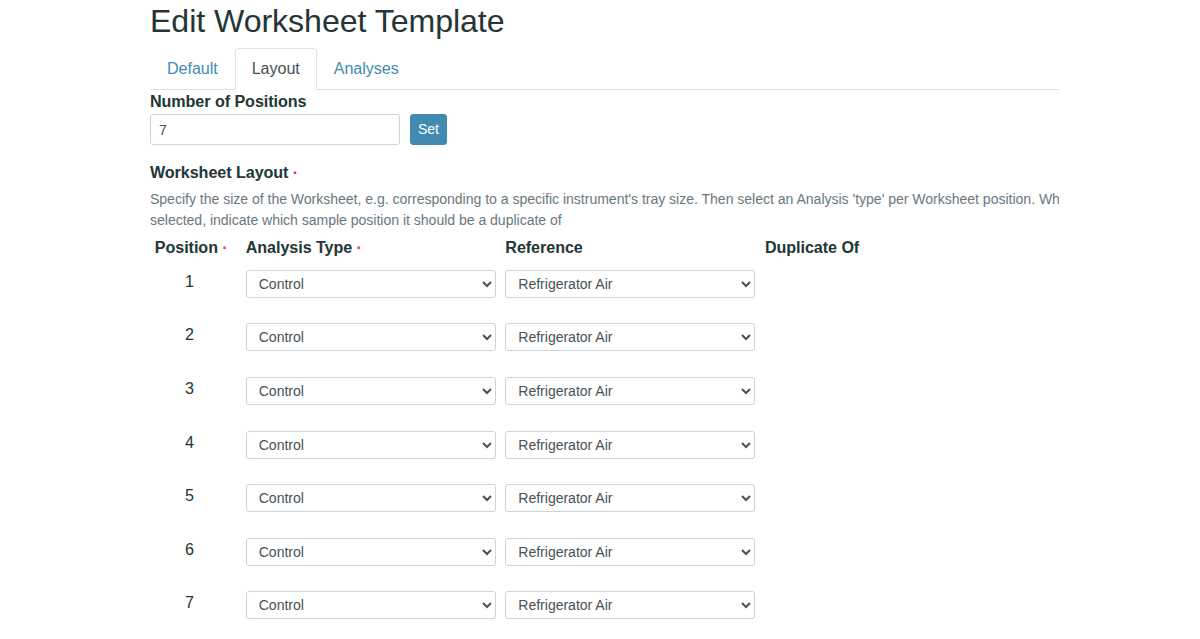
Create a Worksheet Template to do a week's daily measurements with, here we call it Refrigerator Air Weekly
It has 7 positions, all filled reference Samples made with Refrigerator Air Reference Definition
It only has one Analysis Service assigned, Fridge temperature
Manual, Creating Worksheet Templates

Worksheet per Week
Navigate to Worksheets from the lefthand navigation column
Use the Refrigerator Air Weekly Worksheet template to create a new Worksheet
Manual, Worksheets from Templates


The subsequent new Worksheet - it derives its temperature monitoring title from the Category the Fridge Temperature AS belongs too - has seven positions, each filled with a Control Analysis for Fridge Temperature
The user returns to this Worksheet daily to capture the day's temperature
At any given time, labmanagers can look up the Refrigerator Air reference Sample to have a look at results from its Analyses tab
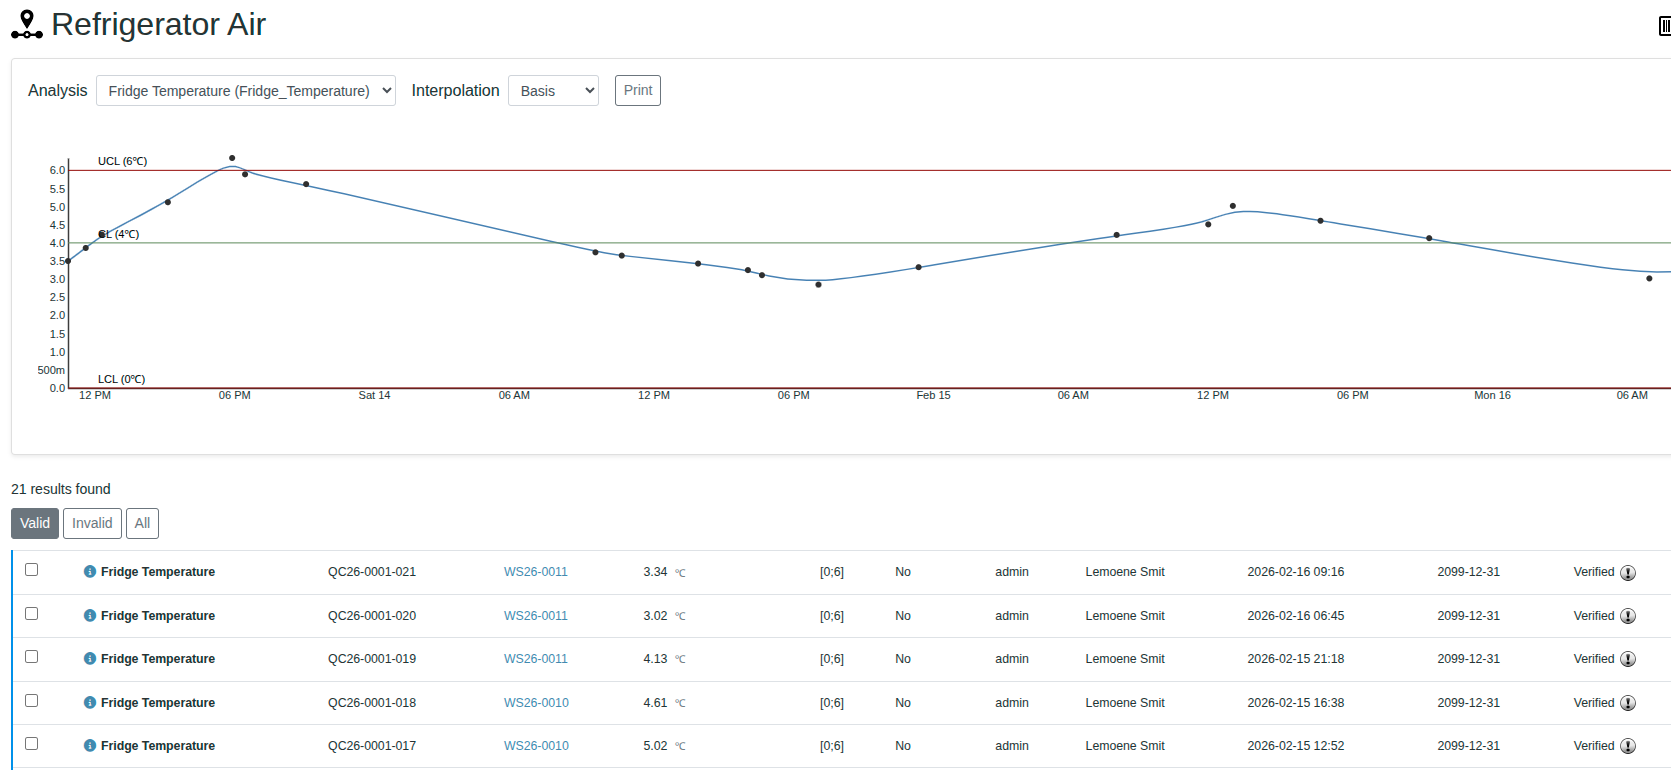
Note the green line, that is the 'expected value', in this case the optimum temperature
Out of Range results are iconised with ared exclamation mark as per Bika Convention
